Saturday, November 4, 2017

WEEKLY MARKET OUTLOOK FOR NOV 06 THRU NOV 10, 2017

WEEKLY MARKET OUTLOOK FOR NOV 06 THRU NOV 10, 2017
In our previous Weekly note, we had mentioned about possibilities of the benchmark NIFTY50 marking fresh marginal highs while still not giving any meaningful up move. In line with this analysis, in the Week that has gone by, the Index continued to mark fresh highs but ended up with net gains of just 129.45 points or 1.25%. In the coming week, we expect the benchmark Index to there are enough signals on the Charts that indicate that any meaningful and serious up move will still continue to elude us. In most likelihood, with the liquidity chasing the momentum vigorously, we will see NIFTY marking intermittent marginal highs.

At this juncture, despite very buoyant undercurrents, we cannot ignore the fact that there are evident bearish divergences on the lead indicators. On the top of this, as very clearly marked on the Charts, the NIFTY has resisted to the upper trend line of the 22-month long upward rising channel that it has been trading in. This is all likely to force and keep the Markets under consolidation at higher levels.

The levels of 10525 and 10690 will play out as immediate resistance levels. Supports exist at 10360 and 10220.

The Relative Strength Index – RSI on the Weekly Chart is 70.9877. It trades moderately overbought. A bearish divergence appears as the NIFTY has marked a fresh 14-period high while RSI did not. Weekly MACD has reported a positive crossover and it is now positive trading above its signal line.

Pattern analysis clearly indicates the Index testing the upper band of the 22-month long trading channel that it has been trading in. In all likelihood, we see the Markets consolidating at higher levels.

All and all, it is beyond all discussions that the undercurrent setup remains buoyant. The only reason Markets have to take a breather is that it has tested the 22-month long trend line and might resist there. Another reason is the persistent bearish divergences that appear on the lead indicators. The F&O data indicates that downsides, if any would remain limited. However, there are all indications that the coming week may remain volatile in nature and see highly sector specific performances taking place.

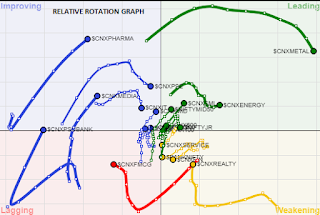
A study of Relative Rotation Graphs – RRG show that significant improvement is seen in PSUBANK pack mainly due to its move in the previous week. It is seen that the PHARMA, AUTO, MEDIA and MIDCAP packs are clearly readying themselves to take on the baton as next relative out-performers over coming week. REALTY is still seen consolidating while the FMCG pack is likely to continue to lag and relatively underperform the general markets. INFRA too is showing distinct signs of strength. METAL is seen slowly continuing to give up momentum though may consolidate and show limited downsides.

Important Note: RRG™ charts show you the relative strength and momentum for a group of stocks. In the above Chart, they show relative performance as against NIFTY Index and should not be used directly as buy or sell signals.

(Milan Vaishnav, CMT, MSTA is Consultant Technical Analyst at Gemstone Equity Research & Advisory Services, Vadodara. He can be reached at milan.vaishnav@equityresearch.asia

Milan Vaishnav, CMT, MSTA
Technical Analyst
(Research Analyst, SEBI Reg. No. INH000003341)
Member

CMT Association (Formerly Market Technicians Association, (MTA), USA
Canadian Society of Technical Analysts, (CSTA), CANADA
Society of Technical Analysts, STA (UK)


+91-70164-32277  /  +91-98250-16331 


Friday, November 3, 2017

MARKET OUTLOOK FOR FRIDAY, NOV 03, 2017

MARKET OUTLOOK FOR FRIDAY, NOV 03, 2017
After a strong session on the previous day, the Indian Equity Markets consolidated on Thursday as the NIFTY50 oscillated in a narrow range while ending the day with a minor loss of 16.70 points or 0.16%. The Markets consolidating after a sharp rise is no doubt a show of underlying strength. However, the rather uncommon thing that is come up is that on one hand, the NIFTY50 has tested and resisted to a 19-month old rising trend line on the Weekly Charts; and on the other hand, a sharp rising in Open Interest along with a decline in NIFTY indicates high addition of short positions in the system. Friday would remain an interesting session to see if the NIFTY continues to consolidate or the persistent show of strength results into sharp short covering.

The resistance levels for NIFTY have now shifted to 10453 and 10565 levels. Supports shifts even lower to 10360 and 10290 zones.

The Relative Strength Index – RSI on the Daily Chart is 69.7761. It has just crossed below the overbought area and this is bearish. The Daily MACD continues to trade above its signal line. Though no very specific formation on Candles was observed, the session represented a spinning-top like formation once again conveying great deal of indecisiveness and caution among participants.

Overall, going into session tomorrow, the breadth of the Markets continues to remain a niggling technical worry and current high of the Markets resists to a 19-month long upward rising trend line is also something we cannot ignore. Momentum may remain, and traders generally have no choice but to chase the momentum. One may do so, but still continue to maintain extremely vigil at higher levels and continue to use up move more for protecting profits at higher levels. Markets are generally expected to remain highly stock / sector specific in nature.

Milan Vaishnav, CMT, MSTA
Technical Analyst 
(Research Analyst, SEBI Reg. No. INH000003341)


Member: 
CMT Association (Formerly known as Market Technicians Association, (MTA), USA
Canadian Society of Technical Analysts, (CSTA), CANADA
Society of Technical Analysts (STA), UK  


+91- 70164-32277  /  +91-98250-16331  

Thursday, November 2, 2017

MARKET OUTLOOK FOR THURSDAY, NOV 02, 2017

MARKET OUTLOOK FOR THURSDAY, NOV 02, 2017
In a striking contrast to what was expected for Tuesday, the NIFTY50 notched up decent gains while it ended the day with net up move of 105.20 points or 1.02%. This up move has come up after a brief congestion some range bound move and it can be generally expected that this may cause the upward momentum to continue. Momentum may remain, and traders generally have no choice but to chase the momentum. One may do so, but still continue to maintain extremely vigil at higher levels and continue to use up move more for protecting profits at higher levels. The breadth of the Markets continues to remain a niggling technical worry and current high of the Markets resists to a 19-month long upward rising trend line.

The levels of 10455 and 10495 may pose some resistance to the Markets. Supports come in at 10380 and 10350 zones.

The Relative Strength Index – RSI on the Daily Chart is 71.5751. It has marked a fresh 14-period high which is bullish but it now trades in overbought territory. The Daily MACD stays bullish while trading above its signal line. A rising window occurred on Candles. This is essentially a gap and results in continuation of upward momentum.

The pattern analysis shows the Markets continuing to surge ahead post its breakout from 10200 zones after a very brief consolidation in between.

All and all, buoyancy may persist and the liquidity may continue to chase the momentum given the present structure of the Chart. However, we have to now chase the momentum with great vigil given the each up move. As mentioned above, the market breadth and the NIFTY testing the 19-month long trend line may continue to remain a niggling source of technical worry. We recommend remaining extremely selective on fresh purchases while maintaining high vigil and protecting profits at at higher levels.

Milan Vaishnav, CMT, MSTA
Technical Analyst 
(Research Analyst, SEBI Reg. No. INH000003341)


Member: 
CMT Association (Formerly known as Market Technicians Association, (MTA), USA
Canadian Society of Technical Analysts, (CSTA), CANADA
Society of Technical Analysts (STA), UK  


+91- 70164-32277  /  +91-98250-16331  

Wednesday, November 1, 2017

MARKET OUTLOOK FOR WEDNESDAY, NOV 01, 2017

MARKET OUTLOOK FOR WEDNESDAY, NOV 01, 2017
Trading session on Tuesday remained subdued and remained modestly under pressure as the benchmark NIFTY50 ended the day losing 28.35 points or 0.27%. Some minor cracks appeared in Metal and Banks while the session remained in a defined range. The Markets have started showing signs of consolidation and the persistent bearish divergences on the lead indicators are likely to keep the Markets in modestly corrective mode for some time. While going into trade on Wednesday, we are likely to see the session showing some isolated out-performances and remaining highly stock specific in nature.

The levels of 10360 and 10400 will pose resistance to the Markets while supports will come in at 10280 and 10210 levels.

The Relative Strength Index – RSI on the Daily Chart is 66.5269 and it remains neutral on the Charts showing no failure swings. The Daily MACD is bullish while it trades above its signal line. However, its trajectory is seen narrowing. A small Engulfing Bearish Line emerged on NIFTY. Though small, it is significant as it has emerged after an up move. This may potentially halt the up move for the immediate short term.

The pattern analysis shows the Index evidently losing steam post attempt to break out from 10200 level. Some minor signals have emerged which show that there may be some more temporary disruption in the up move and the Markets may be forced into some consolidation.

The F&O data also show some minor shorts opening up at higher levels. At this stage, they remain somewhat less significant. Lead indicators show some fatigue and some minor cracks are seen in the market-breadth as well. In all likely hood, we might see some minor disruption in up move happening and the Markets remaining into broad consolidation barring few isolated stock specific out-performances.


Milan Vaishnav, CMT, MSTA
Technical Analyst 
(Research Analyst, SEBI Reg. No. INH000003341)


Member: 
CMT Association (Formerly known as Market Technicians Association, (MTA), USA
Canadian Society of Technical Analysts, (CSTA), CANADA
Society of Technical Analysts (STA), UK 


+91- 70164-32277  /  +91-98250-16331  

Tuesday, October 31, 2017

MARKET OUTLOOK FOR TUESDAY, OCT 31, 2017

MARKET OUTLOOK FOR TUESDAY, OCT 31, 2017
The Indian Equity Markets continued to pile some more gains as the benchmark NIFTY50 ended the day on Monday gaining 40.60 points or 0.39%. Very much on expected line, the Markets are giving marginal highs and putting on gains on end-of-day basis. However, we also need to take on account the fact that the intraday bands are once again getting much narrow. Going into trade on Tuesday, we can expect a modestly positive start to the trade. However, there are some minor signs of Distribution taking place are appearing which we need to look at with some caution.

The levels of 10390 and 10430 will play out as immediate resistance area for the Markets. Supports come in lower at 10310 and 10235 zones.

The Relative Strength Index – RSI on the Daily Chart is 69.6210. It has continued to show Bearish Divergence once again as while NIFTY made a fresh 14-period high, the RSI did not. The Daily MACD is bullish as it trades above its signal line but over previous days, it has flattened its trajectory.

The pattern analysis show that the NIFTY has successfully attempted to breakout from a broad rectangular formation trading range that it has formed over past couple of weeks. However, the breakout is likely see itself losing steam forcing the Markets to likely consolidation at higher levels.

All and all, NIFTY may still continue to pile up some more gains but at the same time, we just cannot and should not ignore the persistent bearish divergences that thrown by the lead indicators on the Charts. These are enough warning signals that the higher levels in the NIFTY could also mean some loss of momentum and some forced corrective consolidation as well. While remaining highly stock specific, cautious outlook is advised for the day.

Milan Vaishnav, CMT, MSTA
Technical Analyst 
(Research Analyst, SEBI Reg. No. INH000003341)


Member: 
CMT Association (Formerly known as Market Technicians Association, (MTA), USA
Canadian Society of Technical Analysts, (CSTA), CANADA
Society of Technical Analysts (STA), UK  


+91- 70164-32277  /  +91-98250-16331  

Monday, October 30, 2017

MARKET OUTLOOK FOR MONDAY, OCT 30, 2017

MARKET OUTLOOK FOR MONDAY, OCT 30, 2017
After remaining range bound in a narrow range all throughout the day on Friday, the Indian Equity Markets lost some ground as the benchmark NIFTY50 ended the session losing 20.75 points or 0.20%. In all likelihood, going into trade on Monday and ahead, we see some more consolidation happening in the Markets. The Markets are likely to trade on the similar lines just like previous entire week. We may see Markets attempting marginal highs but the clean breakout may still remain elusive and we may see some prolonged consolidation in the equity markets.

The levels of 10365 and 10390 will play out as immediate resistance area for the Markets. Supports come in at 10280 and 10235 zones, which are relatively lower than the resistance area.

The Relative Strength Index – RSI on the Daily Chart is 68.5197 and it shows Bearish Divergence as while the NIFTY marked a fresh 14-period high, the RSI did not. Daily MACD stays bearish while trading below its signal line. No significant observations were seen on Candles.

The pattern analysis shows that the NIFTY traded for quite long time for couple of weeks in a broad trading range. In the previous week, the NIFTY has attempted a breakout from this broad trading zone. It has marked fresh highs, but in coming days, it is likely to consolidate at higher levels.

Overall, the closing of the NIFTY above the Bollinger band makes upward breakout possible. However, in the same breath, there are evident divergent signals on the lead indicators on the Daily and Weekly Charts. Due to this, it is highly possible that despite buoyant undercurrents just like in the previous week, we continue to see Markets consolidating at higher levels. We continue to recommend adopting stock specific approach to the Markets on Monday and on coming days as well.

Milan Vaishnav, CMT, MSTA
Technical Analyst 
(Research Analyst, SEBI Reg. No. INH000003341)


Member: 
CMT Association (Formerly known as Market Technicians Association, (MTA), USA
Canadian Society of Technical Analysts, (CSTA), CANADA
Society of Technical Analysts (STA), UK  


+91- 70164-32277  /  +91-98250-16331