Saturday, December 10, 2016

WEEKLY MARKET OUTLOOK FOR DECEMBER 12 THRU DECEMBER 16, 2016

WEEKLY MARKET OUTLOOK FOR DECEMBER 12 THRU DECEMBER 16, 2016
In our previous Weekly note, we had expected the NIFTY to remain stable with positive bias as no major external factor was likely to weigh heavy on the Markets. Keeping in line with this analysis, the Equity 
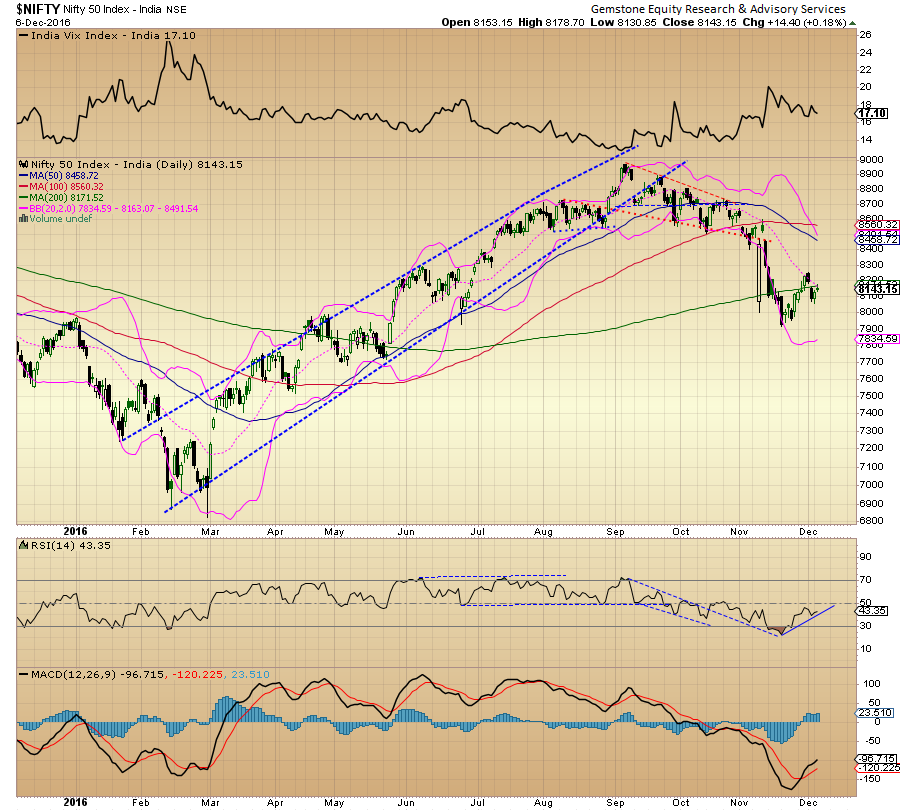
Markets had a stable week as the NIFTY not only moved past its 200-DMA on Daily Charts, took support on the 100-WMA on Weekly Charts and moved past 50-WMA on Weekly Charts as well while successfully marking the recent bottoms. It ended the Week with net Weekly gains of 174.95 points or 2.16% Coming week, we expect the NIFTY to continue to trade with a positive bias and it is expected to continue with its uptick on week-on-week basis. We have two macroeconomic data to deal with in this coming week. Markets are expected to react to Inflation numbers (YOY) coming in on Monday, December 12th and to WPI Inflation numbers coming out on December 14th.  So, given some intermittent bouts NIFTY is overall likely to maintain positive bias. The biggest external news flow that we will need to digest is the Federal Reserve’s decision on Interest Rate hike in the US which comes up in the middle of the coming week.

For the coming week, the NIFTY is likely to find immediate resistance at 8350 and 8425 and supports are likely to come in at 8195 and 8115 levels.

The RSI—Relative Strength Index on the Weekly Charts is 46.6728 and it remains neutral as it shows no bullish or bearish divergence or any failure swings. The Weekly MACD is still bearish as it trades below its signal line. On Candles, a White Body has occurred and with the NIFTY closing at its high point of the weekly bar, it is generally expected that upticks will continue on the Charts.

On the Friday’s session, the NIFTY has once again gone on to add over 2.85 lakh shares in Open Interest. This indicates that we have seen increasing numbers of longs being added to the session since last couple of days.

If we look at Pattern Analysis, the NIFTY had formed a potential bottom at the intraday lows of 7916 as it marked a long lower shadow and a hammer on the Candles in the Week prior to this one. In the following Week, the NIFTY had a flat Week but in this week, it has continued with its up move while forming a White candle with the close very near to its Weekly High. This shows that a potential short term bottom has been confirmed and the NIFTY is more likely to continue with its uptick in the Week to come.

Overall, apart from two macroeconomic data coming out this week, the Federal Reserve Interest Rate decision will weigh heavy on the Markets. The NIFTY is likely to see some volatility remaining heavily ingrained in the sessions and the resistance levels that it has moved past are likely to lend supports in times of volatility. With larger picture favoring the upward bias, we would advice to refrain from any major directional exposure and completely refrain from creating shorts as all dips are likely to get utilized for making fresh purchases. While maintaining more liquidity, cautiously positive outlook is advised for the coming week.

A study of Relative Rotation Graphs – RRG suggest IT stocks will continue to outperform with INFY taking the lead followed by TCS. The Energy and Metal stocks along with PSU Banks are also likely to lead though they will react to some external news flows. AUTO has bucked the trend as they outperformed contrary to our expectations. Improvement in these stocks is likely to continue to moves will remain ranged. PHARMA and INFRA stocks are likely to see modest improvement on week-on-week basis. We are likely to see some weakening in MID50, CNXMID, MNC, FINANCIALS and FMCG Stocks.

Important Note: RRG™ charts show you the relative strength and momentum for a group of stocks. In the above Chart, they show relative performance as against NIFTY Index and should not be used directly as buy or sell signals.

(Milan Vaishnav, CMT, is Consultant Technical Analyst at Gemstone Equity Research & Advisory Services, Vadodara. He can be reached at milan.vaishnav@equityresearch.asia)

Milan Vaishnav, CMT
Technical Analyst
(Research Analyst, SEBI Reg. No. INH000003341)
Member
Market Technicians Association, (MTA), USA
Canadian Society of Technical Analysts, (CSTA), CANADA
Association of Technical Market Analysts, (ATMA), INDIA

http://milan-vaishnav.blogspot.com

+91-98250-16331 


Friday, December 9, 2016

Daily Market Trend Guide -- Friday, December 09, 2016

MARKET TREND FOR FRIDAY, DECEMBER 09, 2016
Much on analyzed lines over past couple of days, the NIFTY finally confirmed its immediate bottom while it saw a sustained all-round rally after consolidating for coupe of days. The NIFTY opened positive, became stronger as we went ahead in the session and ended near the high point of the day while moving past its 200-DMA at Close levels. Speaking purely on technical ground, we may see a stable opening once again tomorrow and expect the NIFTY to continue with its up move at least in the initial trade. Any consolidation will now see 200-DMA as its support and what we have seen is the near term confirmation of recent bottoms. However, we need to closely watch US Bond Yields which refuse to come off and have been steadfastly maintaining its gains. This may continue to remain a reason which may continue to cause the Markets to consolidate at higher levels.

For today, 8275 and 8310 will act as immediate resistance levels while supports remain at 8190 and 9170 levels.

The RSI—Relative Strength Index on the Daily Chart is 50.5007 and it has reached its highest value in last 14-days which is Bullish. It does not show any bullish or bearish divergence. The Daily MACD stays bullish as it continues to trade above its signal line.

On the derivative front, the NIFTY December futures have added a massive 10.32 lakh shares or 6.52% in Open Interest. This shows conviction in the up move.

While having a look at pattern analysis, the NIFTY formed its immediate bottom at 7928 and then had a pullback rally. It came off after resisting to its 200-DMA and had been consolidating since then. It was necessary for the NIFTY to form a higher bottom and resume its up move. With the decent rise that we saw in the previous session, the NIFTY has resumed its up move while forming a higher bottom. In the process, it has moved past its 200-DMA as well which stands at 8190 today. In event of any consolidation, this level is now expected to act as support at close levels.

All and all, the technical structure of the Charts supported by lead indicators and F&O data clearly suggest that upward momentum in the Markets would continue. Only factors that would be of some concern are the US Bond Yields are still strong and showing upward bias and the US Dollar Index which is consolidating heavily with a upward bias. These two factors may cause the NIFTY to consolidate at higher levels once again but inherent strength remains intact and we continue to maintain a positive outlook on the Markets.

Milan Vaishnav, CMT
Technical Analyst
(Research Analyst, SEBI Reg. No. INH000003341)
Member
Market Technicians Association, (MTA), USA
Canadian Society of Technical Analysts, (CSTA), CANADA
Association of Technical Market Analysts, (ATMA), INDIA

http://milan-vaishnav.blogspot.com


+91-98250-16331 

Thursday, December 8, 2016

Daily Market Trend Guide -- Thursday, December 08, 2016

MARKET TREND FOR THURSDAY, DECEMBER 08, 2016
The NIFTY struggled below its 200-DMA in the first half of the session and while it attempted to move past it, RBI Monetary Policy sprung a surprise as it kept all the key rates unchanged when 50 bps rate cut was expected and 25 bps rate cut was already discounted for. RBI kept the rates unchanged, rolled back incremental CRR and revised its FY17 GVA estimate to 7.1%. The NIFTY ended with modest losses though it came off its lows. Today, we will continue to see the NIFTY attempting to move past the 200-DMA and this level will continue to remain the key level to watch for. Yesterday’s volatility has not caused any structural damage and therefore we expect the Markets to continue to consolidate with a positive bias while its behavior vis-à-vis the level of 200-DMA will continue to remain critically important.

For today, the levels of 8185 and 8250 will remain immediate resistance levels while the supports are expected to come in at 8075 and 8030 levels.

The RSI—Relative Strength Index on the Daily Chart is 41.1818 and it remains neutral as it shows no bullish or bearish divergence or any failure swings. The Daily MACD continues to remain bullish as it trades above its signal line. No significant formation on Candles has been observed.

On the derivative front, the NIFTY December futures have added over 3.32 lakh shares or 2.15% in Open Interest. Fresh addition of short positions was seen as well.

If we have look at pattern analysis, post formation of 7929 lows at Close levels, the NIFTY has been consolidating and has been attempting to form a base at current levels. While doing so, it had moved past the 200-DMA once but once again it is trading below its 200-DMA which is 8185 today. In the given structure of the Charts, the NIFTY has been consolidating in a broad range and continued to show positive bias. For it to confirm the base it will have to move past 200-DMA and therefore, the behavior of the NIFTY vis-à-vis the levels of 200-DMA remains important to watch for.

Overall, we have been witnessing small signs of accumulation at current levels and this is causing the NIFTY to consolidate. Upon examination of the overall structure of the technical Charts, and readings when considered along with evidences from the lead indicators and the F&O data, the NIFTY is currently exhibiting a positive bias. It is likely that we continue to see volatility and intermittent bouts but overall bias and inherent strength looks evident. With sector specific out-performance likely to continue, accumulation of key / quality stocks is advised in moderate quantities.

Milan Vaishnav, CMT
Technical Analyst
(Research Analyst, SEBI Reg. No. INH000003341)
Member
Market Technicians Association, (MTA), USA
Canadian Society of Technical Analysts, (CSTA), CANADA
Association of Technical Market Analysts, (ATMA), INDIA

http://milan-vaishnav.blogspot.com


+91-98250-16331 

Wednesday, December 7, 2016

Daily Market Trend Guide -- Wednesday, December 07, 2016

MARKET TREND FOR WEDNESDAY, DECEMBER 07, 2016
While continuing to trade very much on expected lines, the NIFTY ended the day with just minor gains after coming off from its highs in the last hour of the day. It continued to consolidate heavily and also continue to resist to its 200-DMA at Close levels. Today as well, we expect the Markets to continue to consolidate with positive bias. Today, we have RBI Monetary Policy to react to and a 50 bps cut in the Repo Rate is expected. Banks will particularly react to this as we move ahead in the session and volatility is expected to remain ingrained and the levels of 200-DMA will be critical to watch out for.

For today, the levels of 8179 and 8250 will remain immediate resistance levels for the Markets. The supports come in at 8090 and 8025 levels.

The RSI—Relative Strength Index on the Daily Chart is 43.3319 and it remains neutral as it continue to show no bullish or bearish divergence or any failure swings. The Daily MACD remains bullish while trading above its signal line. No significant Candle was observed apart from a spinning top was observed in the yesterday’s session.

On the derivative front, the NIFTY has shed 21,150 shares or just 0.14% in Open Interest. The OI figure has remain unchanged signifies no major shorts or longs were added in the system and the NIFTY remained direction-less on the Daily Charts.

While having a look at pattern analysis, the NIFTY is trying hard to confirm the bottom that it formed at 7929 at Close levels. After attempting to form base at this level, the NIFTY showed a decent pullback and retraced some portion of that pullback. In the process, it currently trades below the 200-DMA once again. Currently, it would be important for the Markets to make a higher top and resume its up move. It would also be crucially important for the Markets to move past the 200-DMA and sustain above that.

All and all, the levels of 200-DMA continue to remain crucial and it is imperative for the NIFTY to move past that level and Close above that. This will confirm the immediate bottom for the NIFTY and for this resumption of the pullback is necessary. In today’s session, some volatility will remain as the Markets  will react to the RBI Monetary Policy. The lead indicators and the F&O data suggest some more consolidation but that would remain with a positive bias. All dips are likely see short covering and some fresh purchases. With sector rotation and some stock specific out-performance likely, continuation of cautiously positive outlook is advised for the day.

Milan Vaishnav, CMT
Technical Analyst
(Research Analyst, SEBI Reg. No. INH000003341)
Member
Market Technicians Association, (MTA), USA
Canadian Society of Technical Analysts, (CSTA), CANADA
Association of Technical Market Analysts, (ATMA), INDIA

http://milan-vaishnav.blogspot.com


+91-98250-16331 

Tuesday, December 6, 2016

Daily Market Trend Guide -- Tuesday, December 06, 2016

MARKET TREND FOR TUESDAY, DECEMBER 06, 2016
The Markets traded precisely as analyzed in our yesterday’s edition as it consolidated and also maintained a positive bias while ending with modest gains. The NIFTY consolidated and traded with minor losses in the first half while the second half saw the NIFTY closing near the high point of the day. Today, we expect the Markets to open on a flat to mildly positive note and in all likelihood it is expected to continue its recovery, at least in the initial trade. However, it is important to note that it still trades below the 200-DMA and it is crucially important for the Markets to move past this level.

For today, the levels of 8175 and 8250 will act as immediate resistance levels for the Markets. The supports will come in at 8065 and 8010 levels.

The RSI—Relative Strength Index on the Daily Chart is 42.3528 and it remains neutral as it shows no bullish or bearish divergence or any failure swings. The Daily MACD stays bullish as it continues to trade above the signal line.

On the derivative front, the NIFTY December futures have shed over 2.12 lakh shares or 1.35% in Open Interest. This remains mainly due to the short covering that the NIFTY saw from the low point of the day. It will be important to see if this gets replaced in the coming sessions by fresh longs.

While having a look at pattern analysis, the NIFTY has not yet violated the lows of 7926 levels. While pulling back, it has attempted to form a higher bottom as well. However, presently it trades below its 200-DMA which is 8173. It would be crucially important for the NIFTY to move past and close above this level in order to continue with its pullback effectively. So long as NIFTY rules below 200-DMA, it will continue to remain vulnerable to selling pressures from higher levels.

All and all, the level of 200-DMA will be critical to watch out for as it would be of paramount importance for NIFTY to move past this level and Close above this. Until this happens, we cannot rule out the NIFTY consolidating and being subject to some intermittent selling pressures at higher levels. However, with the Markets not breaching its immediate lows, and while it is attempting to form a higher bottom while pulling back, we continue to reiterate to refrain from creating major shorts positions. Instead, it is advised to continue to use all dips to make select purchases. Continuation of positively cautious outlook is advised for the day.

Milan Vaishnav, CMT
Technical Analyst
(Research Analyst, SEBI Reg. No. INH000003341)
Member
Market Technicians Association, (MTA), USA
Canadian Society of Technical Analysts, (CSTA), CANADA
Association of Technical Market Analysts, (ATMA), INDIA

http://milan-vaishnav.blogspot.com


+91-98250-16331 

Monday, December 5, 2016

Daily Market Trend Guide -- Monday, December 05, 2016

MARKET TREND FOR MONDAY, DECEMBER 05, 2016
Equity Markets remained in corrective mode and more so in the second half of the session on Friday as the NIFTY ended in the read while closing below its 200-DMA once again. Today, we can expect a quiet start to the Markets but in the same breath, we do not expect a run-away rally in the Markets so long as it continues to trade below its 200-DMA. Markets have an external event of RBI Monetary Policy on 7th of December to react to but until then it is likely that we will see the NIFTY remaining in a broad range and consolidate while remaining vulnerable to selling bouts so long as it continues to trade below the 200-DMA which is 8169 today.

For today, the levels of 8125 and 8175 will act as immediate resistance levels for the Markets. The supports are expected to come in at 8050 and 8010 levels.

The RSI—Relative Strength Index on the Daily Chart is 39.5260 and it is neutral as it shows no bullish or bearish divergence or any failure swings. The Daily MACD is bullish as it trades above its signal line. On the Candles, a falling window occurs. This means a gap and it shows that possibility of bearish sentiment will persist on the following day.

On the derivative front, the NIFTY December futures have shed over 3.68 lakh shares or 2.29% in Open Interest. This implies some shedding of longs from the system.

Coming to pattern analysis, the NIFTY has formed an immediate bottom at 7929 and has attempted a pullback since then. In the process, the NIFTY has also managed to move past its 200-DMA but the previous two sessions have seen it correcting which saw the NIFTY trading once again below its 200-DMA. In the present scenario, we will see the levels of 200-DMA acting as the immediate resistance at Close levels for the NIFTY. On the other hand, even if the NIFTY continues to see corrective decline and tests 8010-8025 levels and bounces back, it will still be within the pattern and the possibility of its confirming the bottom still remains if these levels are not broken.

All and all, until the NIFTY breaches the 8010 levels, there will be no breach of the current pattern support and therefore so long as these levels are sustained, we would advice that no major shorts should be created. There is strong possibility that the NIFT takes support at current levels or around 8010-8025 levels as these are important pattern supports. We continue with our recommendation of accumulating quality stocks with each downside until these levels are sustained. Overall, positive caution is advised in the Markets.

Milan Vaishnav, CMT
Technical Analyst
(Research Analyst, SEBI Reg. No. INH000003341)
Member
Market Technicians Association, (MTA), USA
Canadian Society of Technical Analysts, (CSTA), CANADA
Association of Technical Market Analysts, (ATMA), INDIA

http://milan-vaishnav.blogspot.com


+91-98250-16331 

Sunday, December 4, 2016

Weekly Technical View - NIFTY - December 05 thru December 09, 2016

WEEKLY MARKET OUTLOOK FOR DECEMBER 05 THRU DECEMBER 09, 2016
While we refer our previous Weekly Note, we had mentioned that though we remain positive bias towards a pullback, consolidation at present levels cannot be ruled out. Keeping precisely in line with this analysis, the NIFTY consolidated on week-on-week basis and ended the week nearly flat with a modest loss of 27.50 points or 0.34%. The analysis remains on similar note also for the following week. We feel that the NIFTY is likely to continue to consolidate with a upward bias even if it witnesses intermittent selling bouts. The current bottom that it has recently formed is all likely to stay protected. The NIFTY is likely to react to RBI Monetary policy on December 7th and apart from this, the US Bond Yields are expected to remain steady and no major sharp rise is expected.

For the coming week, the levels of 8175 and 8250 will remain important resistance levels to watch for. The supports are expected at 8050 and 7960 levels.

The RSI—Relative Strength Index on the Weekly Chart is 40.1345 and it remains neutral as it shows no bullish or bearish divergence or any failure swings. The Weekly MACD continues to remain bearish while it trades below the signal line. On the Candles, a long upper shadow has occurred. This will have no significance with the present structure of the Chart as it has not occurred after any uptrend.

Coming to pattern analysis, the NIFTY formed a Double Top formation near 8866levels at Close and has declined since that time. Today, it stands corrected by nearly 882-odd points and stands nearly 38.2% corrected on Close levels from its recent up move from 7029 to 8866 levels. Further to this, it is still trading a not below (outside) the lower Bollinger Band and it would be important for the Markets to stay inside the band to avoid any short moves on the downside. On week-on-week basis, the  OI has increased with the daily declines that the NIFTY has witnessed indicating some existence of fresh short positions in the Markets.

Overall, though we do not see any run-away rally in the Markets, there will be couple of things that the NIFTY will need to take care of to avoid any further weakness from creeping in. It will need to crawl back above the 200-DMA on Daily Charts, and also move past 8195 levels which is the 100-WMA and important pattern resistance apart from 200-DMA at Close. Apart from the monetary policy that Markets will react to, we do not see any external factors negatively affecting the markets. Also, given the F&O data read along with the lead indicators, the downsides may remain limited on weekly basis. We continue to advice creating any major directional positions. While maintaining more cash and liquidity, purchases in limited quantities may be made in select stocks.

A study of Relative Rotation Graphs – RRG suggest just like previous two Weeks, we will continue to see relative out-performance from IT Stocks. Apart from this, considerable improvement in PHARMA stocks, PSUBANKS and Metals will be seen. Some out-performance from select MidCaps and Energy Stocks can also be expected. AUTO stocks are likely to remain laggards. Weakness can be expected in FMCG and some portion of NIFTYMID50 Index.

 Important Note: RRG™ charts show you the relative strength and momentum for a group of stocks. In the above Chart, they show relative performance as against NIFTY Index and should not be used directly as buy or sell signals.

(Milan Vaishnav, CMT, is Consultant Technical Analyst at Gemstone Equity Research & Advisory Services, Vadodara. He can be reached at milan.vaishnav@equityresearch.asia)

Milan Vaishnav, CMT
Technical Analyst
(Research Analyst, SEBI Reg. No. INH000003341)
Member
Market Technicians Association, (MTA), USA
Canadian Society of Technical Analysts, (CSTA), CANADA
Association of Technical Market Analysts, (ATMA), INDIA

http://milan-vaishnav.blogspot.com

+91-98250-16331