Saturday, November 26, 2016

WEEKLY MARKET OUTLOOK FOR NOVEMBER 28 THRU DECEMBER 02 2016

The NIFTY ended the previous week with a modest gain of 40.20 points or 0.50% thanks to the decent sustained recovers that we saw in the Friday’s session. The Markets are indicating continuance of technical pullback on week-on-week bases which began in the previous session. The bias remains towards continuation of pullback but with some caveats. The NIFTY still rules below 200-DMA on Daily Charts, outside the lower band of Bollinger Band on the Weekly Charts and also below some critical resistance levels on the Weekly Charts. However, due to all this some consolidation in a  broad range cannot be ruled out but overall the NIFTY is likely to show resilience to any serious downsides in coming week and this keeps the bias positive.

For coming Week, the levels of 8168 and 8245 will remain immediate resistance levels to watch out for. The supports will exist at 7916 7850 levels.

The RSI—Relative Strength Index on the Weekly Chart is 40.8659 and this remains neutral as it shows no bullish or bearish divergence or any failure swings. The Weekly MACD still continues to remain bearish as it trades below its signal line. On Candles, a Hammer occurred. Hammers must appear after a significant decline or when prices are oversold (which appears to be the case with * NIFTY 50) to be valid.  When this occurs, it usually indicates the formation of a support level and is thus considered a bullish pattern. This pattern is similar to Hanging Man pattern but since occurred during a downtrend, it is called a Bullish Hammer. Such pattern also has a long lower shadow.

On the derivative front, the NIFTY has began the December series while shedding over 8.67 lakh shares or 5.78% in Open Interest. This signifies heavy short covering in Friday’s session. It would be critical to see if see this being replaced with fresh longs and purchases.

Coming to pattern analysis, the NIFTY have retraced nearly 900-odd points after it formed a Double Top formation near 8968 levels and resisted to it. This week, after the retracement of nearly 900-odd points, it has shown a mild uptick and some indication that a potential bottom has been formed near 7916-7950 zones. Currently it trades outside the lower band of the Bollinger Band and with RSI still ruling comfortably above 30, it would be critical for the NIFTY to crawl back inside the band to avoid any fresh weakness from creeping in. Further, the zones of 8140-8165 will be critical to watch out for. NIFTY will have to move past these zones and trade above this to remain afloat and try and confirm the potential bottom formation.

Overall, in coming week, though we maintain a positive bias towards pullback, we do not rule out consolidation happing at higher levels. This will induce volatility in the sessions and also see some intermittent selling bouts from higher levels. With the current lows of 7916 acting as base, we will see the NIFTY oscillating in a broad range while maintaining positive bias. We will see sector rotation also taking pace and will see quality stocks distinctively out-performing the general Markets. We maintain our view of refraining from shorts and use all intermittent downsides to accumulate select stocks.

A study of Relative Rotation Graphs – RRG suggest that IT stocks will continue to improve their performance. During last two Weekly readings we had mentioned that IT Stocks will show resilience, form base and improve. This precisely has happened.  This coming week as well, we will continue to see IT and PHARMA stocks continuing to improve their relative performance. Also, PSU Banks, ENERGY, CNX MID50 and METAL will out-perform NIFTY on relative basis. Some continued weakening will be observed in NIFTYJR, BANKNIFTY, FINANIALS, and AUTO which are expected to struggle to find feet. Some improvement in INFRA stocks can also be expected in coming week.

 Important Note: RRG™ charts show you the relative strength and momentum for a group of stocks. In the above Chart, they show relative performance as against NIFTY Index and should not be used directly as buy or sell signals.

(Milan Vaishnav, CMT, is Consultant Technical Analyst at Gemstone Equity Research & Advisory Services, Vadodara. He can be reached at milan.vaishnav@equityresearch.asia)


Milan Vaishnav, CMT
Technical Analyst
(Research Analyst, SEBI Reg. No. INH000003341)
Member
Market Technicians Association, (MTA), USA
Canadian Society of Technical Analysts, (CSTA), CANADA
Association of Technical Market Analysts, (ATMA), INDIA

http://milan-vaishnav.blogspot.com

+91-98250-16331 


Friday, November 25, 2016

Daily Market Trend Guide -- Friday, November 25, 2016

MARKET TREND FOR FRIDAY, NOVEMBER 25, 2016
Very much on expected lines, the second half of the session yesterday saw good amount of volatility in the Equity Markets as the NIFTY once again ended in the red after 60-point swing in the either side and taking the NIFTY once again in the “oversold” territory. Failure of the NIFTY to sustain above 8020-8040 spelled expected weakness as well. Today, though we might see some stable opening, the possibility of the NIFTY tracking the lower band of the Bollinger Band cannot be ruled out and some volatility coupled with some weakness on week-on-week basis can also persist and the zones of 8020-8040 will be critical levels to watch out for.

For today, the levels of 8010 and 8045 will act as immediate resistance levels while the supports come in at 7915 and 7855 levels.

The RSI—Relative Strength Index on the Daily Chart is 28.5914 and it is neutral as RSI does not show any bullish or bearish divergence or any failure swings. It now currently rules once again in “oversold” territory. Daily MACD is bearish as it trades below its signal line.

Coming to pattern analysis, the NIFTY once again moved towards testing its recent lows of 7916 though it is currently trading above it. The NIFTY has lost more than what is involved in its measuring implications after breaking on the downside from a falling channel formation after it made its recent highs of 8968. While on its way down, the NIFTY has  also breached its 200-DMA which is 8146 and this level is expected to act as resistance while the NIFT attempts to form a base and pullback.

Given the oversold nature of the Markets, we may again expect some possibilities of a technical pullback even while we continue to remain in a downtrend. It is very much likely that the downsides in the Markets remain limited and we see NIFTY trading in broad trading range and consolidate. The Bollinger Bands which are 114% wider than normal indicate periods of high volatility. Given that the bands have been wider since last 7 periods, probability of prices consolidating into a less volatile trading range increases the longer the bands remain in this wide range. In view of this, we continue to advice to refrain from creating short positions and continue to accumulate quality stocks at each lower level.


Milan Vaishnav, CMT
Technical Analyst
(Research Analyst, SEBI Reg. No. INH000003341)
Member
Market Technicians Association, (MTA), USA
Canadian Society of Technical Analysts, (CSTA), CANADA
Association of Technical Market Analysts, (ATMA), INDIA

http://milan-vaishnav.blogspot.com


+91-98250-16331 

Thursday, November 24, 2016

A TIME TO BEGIN PORTFOLIO BUILDING AT CURRENT LEVELS? A CRITICAL INTER-MARKET TECHNICAL VIEW.


Indian Equities formed a low of 6985 immediate in February end and since then it began a upward move. It went on to rally for nearly 2000-odd points while it formed an intermediate peak on Daily Chart, a Double Top on Weekly Chart simultaneously around 8968 levels. It halted the up move and entered into intermediate downtrend in form of a falling channel, subsequently breaching that channel to form the lows of 7916, retracing nearly 50% of the referred up move. During this time, we digested Brexit, Donald Trump victory, Demonetization and its feared impact on slowdown in coming quarters.


Let us now examine the Fixed Income Asset and its correlation with Equities.  The above is a 10-YR US TREASURY NOTES CONTINOUS (CBT) Chart. If one sees, during the same time in July, along with Equities, the Bond price too made its top around USD133-USD134 range and transformed into a falling Channel.

A Fixed Income Analyst would have foreseen the sharp decline in Equities that we witnessed, especially over last fortnight.  The ferocity of the fall in Equities to do with the above Chart as well.  If we examine the above Chart, The US 10-YR Bond prices reported a “Death Cross” wherein its 50-DMA reported a negative crossover over 200-DMA. This was sometime beginning of November. This is a technically bearish sign indicating that an issue will have bearish implication going ahead. We saw the Bond prices, which were comfortably in a falling channel at that point of time, came to a sharp decline,  gave a downward breakout from the falling channel, went beyond its measuring implications and touched a low of USD 126.06.

We know that Bond Prices and Equities have direct correlation. Similarly, Yields and Equities have a negative correlation. The fall in Bond prices caused the Yields to move up sharply as indicated in the below Chart.

 CURRENT VIEW

We believe, at present levels, the Equities may be well within its range of finding a bottom for itself in the near term. Let us examine few points that support this view, though potentially.

The Bond Prices, which trade “oversold” on both Daily and Weekly Charts, also trade near its multiyear support levels of 125 and 122. If we examine yields, it does have some room left on upside. This may be filled up by the Bonds which may still see minor pressure in the range of 122-125 which are its multiyear supports. However, they are expected to stabilize in the referred zone.

By the time this happen, we are likely to see some volatile ranged movements in the Equities. It is most  likely scenario, the Equities may continue to witness volatile sell-offs from higher levels, but it is likely to remain in a broad range and current lows are less likely to be broken and is likely to have very limited downsides beyond that. During these broad movements, we are likely to witness some potential signs of Accumulation as well.


Keeping all this in collective view, we believe it is time to start staggering purchases in key large caps and very select MidCap stocks. The current sharp decline has presented an excellent  opportunity to start building long term portfolios  and one can easily begin with exposing around    20-30% of the amount available for Investment.

Even if we apprehend a actual slowdown in consumption in the coming 2-3 Quarters following Demonetization, exposing 20-30% will not a bad idea as it keeps sufficient liquidity for a long term investor to Capitalize on some more downsides while investing over the long term as the downsides, if viewed in a long-term horizon seem and remain limited even in the view of the pending US Interest Rate hike.
 
Another important factor that we need to take into account is the strength of USD. This otherwise act against the Equities and US Dollar is likely to enter into a long term up move over coming months as indicated by US Dollar Index 15-Year Monthly Chart on the left.

However, this should not be viewed singularly. This is a global phenomenon and US Dollar will strengthen across world currencies and currencies of Emerging Markets and again, within Emerging Markets, Indian Rupee (INR) continue to remain resilient and a relative out-performer.


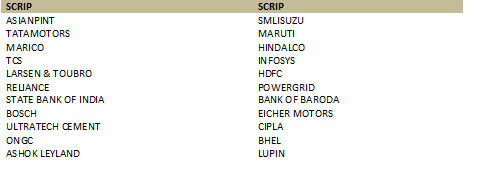
Based on Study of Long Term Charts, we have short listed few stocks, both Large and MidCap which Investors should start “Accumulating” at current and each lower levels with a long term investment


Disclosure pursuant to Clause 19 of SEBI (Research Analysts) Regulations 2014: Analyst, Family Members or his Associates holds no financial interest below 1% or higher 1% and has not received any compensation from the Companies discussed.


Milan Vaishnav, CMT
Technical Analyst
(Research Analyst, SEBI Reg. No. INH000003341)
Member:
 Market Technicians Association, (MTA), USA
Member: Association of Technical Market Analysts, (ATMA), INDIA
www.EquityResearch.asia
http://milan-vaishnav.blogspot.com

+91-98250-16331
milan.vaishnav@equityresearch.asia
milanvaishnav@yahoo.com


Daily Market Trend Guide -- Thursday, November 24, 2016

MARKET TREND FOR THURSDAY, NOVEMBER 24, 2016
The Markets continued to end the day yesterday with modest gains after recovering from the morning lows. It is important to note that that NIFTY has ended in green for the second day in a row but it is lacking the conviction that a strong sustainable pullback requires. Today, we enter the expiry day of the current derivative series and we will see the session remaining dominated with rollover centric activities and we will continue to see volatility remaining ingrained in the Markets. The sustenance above 8040 levels will be critical to watch for as we expect a subdued, and flat to mildly negative opening for today.

Today, the levels of 8065 and 8144 will act as immediate resistance levels for the Markets. The supports come in at 7975 and 7920 levels.

The RSI—Relative Strength Index on the Daily Chart is 30.8628 and it has just crossed above from a bottoming formation which is bullish. It does not show any bullish or bearish divergence or any failure swing. The Daily MACD still rules bearish as it continues to trade below its signal line. On significant formation on Candles is noticed. The current candles closely resembles a hammer but presence of negligible upper shadow and less-than-required length of the lower shadow makes is very less important a formation in relative terms.

On the derivative front, the NIFTY November series shed 25.08 lakh shares or 16.44% in Open Interest. The NIFTY December series saw addition of 24.95 lakh shares or 37.30% in OI. There has been net shedding of OI seen though the NIFTY PCR  still remains much lower and at comfortable levels.

Coming to pattern analysis, as we have often mentioned that the NIFTY has completed the measuring implications associated with it breaching the falling channel on the downside. It currently trades below the 200-DMA and has been attempting to find a base in the current zone. At Close, it would be critically important for the NIFTY to maintain close above 8050 levels to avoid weakness from reappearing. If it does so, it is likely to logically proceed towards its immediate resistance levels of 200-DMA which is 8144 today. Ruling below 8050 is likely to induce some temporary weakness once again.

Overall, given the expiry day, we will see the session remain dominated with rollovers. If we examine the inverse relation of the Equity Markets with US10-YR Bond Yield, it still has some room left on upside on Weekly Charts. This may keep our domestic markets spooky on week-on-week basis. We may see the Markets oscillating in a broad range wherein we have to see if it shows any sign of accumulation. We strongly reiterate to stays away from participation in event of any downsides and avoid creation of fresh shorts. All dips are likely to see sector rotation and select purchases. Cautious but positive view is advised for today.

Milan Vaishnav, CMT
Technical Analyst
(Research Analyst, SEBI Reg. No. INH000003341)
Member
Market Technicians Association, (MTA), USA
Canadian Society of Technical Analysts, (CSTA), CANADA
Association of Technical Market Analysts, (ATMA), INDIA

http://milan-vaishnav.blogspot.com


+91-98250-16331 

Wednesday, November 23, 2016

Daily Market Trend Guide -- Wednesday, November 23, 2016

MARKET TREND FOR WEDNESDAY, NOVEMBER 23, 2016
We refer to our previous Market Outlook wherein we had refer to what is known as “selling extremes” and had expected a pullback following this. Yesterday’s though the session remained quite volatile, the NIFTY managed to end its losing streak and ended with modest gains near the high point of the day. Though Markets have displayed basic signs of beginning of a pullback, we must bear in mind that this would be a “pullback” and not a “reversal” and for this we will require confirmations in days to come. Today, we can fairly expect the day to have stable start and NIFTY might logically proceed with its pullback. Today also is a penultimate day of expiry of current derivative series and we cannot therefore rule out volatility induced by rollovers in next two days.

For today, the levels of 8065 and 8142 will act as immediate resistance levels for the Markets. The supports come in at 7940 and 7905 levels.

The RSI—Relative Strength Index on the Daily Chart is 28.4495 and it remains neutral as it shows no bullish or bearish divergence or any failure swings. However, it still continues to tread in “oversold” territory. The Daily MACD continues to trade bullish as it remains below its signal line. On Candles, a Spinning Top has occurred which identifies a session which has narrow price action as defined by difference between open and close. However, the more important formation is that of a Bullish Harami pattern. This is a real body engulfed completely by the prior body. The importance of this formation is that it is NOT a reversal but often marks a pause or halt in a current trend (decline) and lays down chances for a pullback. However, this needs confirmation on the following day.  What makes this even more valid is color of the bullish harami candle is that of opposite color of its prior engulfing candle. There is no Hammer pattern in the Chart as the shadow of the current candle is not long enough than what it is technically required.

Coming to pattern analysis, the NIFTY has maintained to form a lower low and has managed to crawl back within the lower band of the Bollinger Band. Furthermore, the lead indicators continuing to being oversold, it continues to display higher possibilities of technical pullback continuing. The logical resistance levels until which the pullback should continue is the 200-DMA which is 8142 today. Only after that we will see if the NIFTY has just pulled back or it is trying to establish a bottom.

All and all, speaking purely on technical terms, if the NIFTY sustains above 8000-8025 mark, it may induce further short covering. It is important to note that what we expect is the pullback to continue but rollovers induced volatility will remain ingrained. Given the oversold nature of the Markets, we continue to reiterate to avoid any major shorts and any dips should be utilized to make select purchases.  We advise cautiously positive outlook for the Markets today.

Milan Vaishnav, CMT
Technical Analyst
(Research Analyst, SEBI Reg. No. INH000003341)
Member
Market Technicians Association, (MTA), USA
Canadian Society of Technical Analysts, (CSTA), CANADA
Association of Technical Market Analysts, (ATMA), INDIA

http://milan-vaishnav.blogspot.com


+91-98250-16331 

Tuesday, November 22, 2016

Daily Market Trend Guide -- Tuesday, November 22, 2016

MARKET TREND FOR TUESDAY, NOVEMBER 22, 2016
Monday’s session remained firmly in grip of bears as the NIFTY took a sharp cut and ended at 6-month closing lows. We refer our Weekly Note wherein we had mentioned “….On the Weekly Charts, the NIFTY has  closed below (outside) the lower Bollinger Band. This has several implications. Though Bollinger Bands individually do not generate buy or sell signals, if it is read along with RSI, it throws up powerful readings. In NIFTY’s case, the NIFTY on the Weekly Chart has closed below (outside) the lower Bollinger Band and with the RSI above 30, (39.3661), there are fair amount of chances that the current downtrend continues……” Though this was expected later in the week, it came too soon and too fast on Monday. Importantly¸ this also leaves us with what is also known as “selling extremes” wherein we get a big bar with the Markets that are anyways oversold sees itself ending itself near the day’s low with average or higher than average volumes. This “potentially” marks a temporary bottom; though this needs confirmation on the following day.

For today, the levels of 8005 and 8065 might act as immediate resistance levels if a imminent pullback occurs. Supports exist at 7905 and 7850 levels.

The RSI—Relative Strength Index on the Daily Chart is 22.5195 and it has reached its lowest value in last 14-days which is bearish. However, it does not show any bullish or bearish divergence and it remains “deeply oversold”. The Daily MACD stays bearish while trading below its signal line.

On derivatives front, the NIFTY November futures have shed over 8.03 lakh shares or 4.60% in Open Interest. The December futures added over 27.65 lakh shares or 128.71% In Open Interest indicating huge net addition in Open Interest. This shows great addition of shorts in the system and the NIFTY PCR stands below 0.75 indicating oversold levels.

Coming to pattern analysis, with yesterday’s cut, the NIFTY not only went beyond its technical measuring implications that occurred upon its breaking the falling channel drawn from 8968 levels, it went on to breach the 200-DMA and its filter as well. However, while doing so, it continued to get “deeply oversold”. Furthermore, as mentioned above, the current formation has market what is known as “selling extremes”. Though this is a potential indication that a pullback / reversal may occur this needs confirmation on the following day.

All and all, one more important thing that needs to be taken note of is that it is the expiry week and off late the Markets in general and NIFTY in particular has never been so deeply oversold and it has rarely displayed such oversold readings. With the given amount of short and these readings, a technical pullback remains imminent. We strongly recommend not creating any major fresh shorts and in event of continuing decline, participation in the Markets should be avoided. While maintaining and preserving cash levels, an imminent and long-overdue pullback should be expected.

Milan Vaishnav, CMT
Technical Analyst
(Research Analyst, SEBI Reg. No. INH000003341)
Member
Market Technicians Association, (MTA), USA
Canadian Society of Technical Analysts, (CSTA), CANADA
Association of Technical Market Analysts, (ATMA), INDIA

http://milan-vaishnav.blogspot.com


+91-98250-16331 

Monday, November 21, 2016

Daily Market Trend Guide -- Monday, November 21, 2016

MARKET TREND FOR MONDAY, NOVEMBER 21, 2016
The session Friday remained much narrow while the  NIFTY ended the day with nominal losses after spending the day in a capped range. Today, we once again keep the analysis on similar lines with more tilt towards possibility of a technical pullback as NIFTY continues to remain oversold and lead indicators not making fresh lows. It is important to note that the NIFTY also continues to track the lower band of the Bollinger Band while it has closed inside it as well even if it trades below 200-DMA at close levels which is 8137 today.

For today the levels of 8137 and 8195 will act as immediate resistance levels for today. The supports come in at 8048 and 7965 levels.

The RSI—Relative Strength Index on the Daily Chart is 26.5700 and it has reached its lowest value in last 14-days which is Bearish. It does not show any bullish or bearish divergence. The Daily MACD continues to remain bearish as it trades below its signal line. On Candles,  a Spinning Top  occurred. Such sessions are typically session with little price action as defined by difference between the Open and Close prices. This indicates indecisiveness on part of market participants and often warrants a potential change in existing trend.

On the derivative front, the NIFTY November futures have shed over 13.36 lakh shares or 7.11% in Open Interest. The December futures added over 3.69 lakh shares in OI. The NIFTY PCR stands well below 0.80 at oversold levels.

Coming to pattern analysis, the NIFTY has competed the measuring implications followed by the downward breakout from the falling channel it has formed from 8968 levels. Though it currently trades below 200-DMA at close levels, it still remain within its 1% filter. Also, with the NIFTY PCR below 0.80 and lead indicators remaining oversold, it is more likely that we see an imminent technical pullback even when we remain in continuing downtrend. 
The NIFTY currently is tracking the lower band of Bollinger Band. This, when read along with RSI, gives meaningful insight. With RSI being “oversold” territory and NIFTY closing inside (above) the lower band of Bollinger Band, it shows higher chances of a technical pullback.

All and all, there is slight contradiction in the Weekly charts as mentioned in our Weekly note but on Daily Charts, a technical pullback, even if a limited one remains overdue and imminent. The 200-DMA which is 8137 will be immediate resistance but if the NIFTY manages to pullback above this level, it may lay and prepare grounds for a potential bottom formation. Though cash levels should be preserved, selective purchases may be made in modest quantities. Cautious optimism is advised for today.

Milan Vaishnav, CMT
Technical Analyst
(Research Analyst, SEBI Reg. No. INH000003341)
Member
Market Technicians Association, (MTA), USA
Canadian Society of Technical Analysts, (CSTA), CANADA
Association of Technical Market Analysts, (ATMA), INDIA

http://milan-vaishnav.blogspot.com


+91-98250-16331