Saturday, January 13, 2018

WEEKLY MARKET OUTLOOK FOR JAN 15 THRU JAN 19, 2018

WEEKLY MARKET OUTLOOK FOR JAN 15 THRU JAN 19, 2018
After many range bound oscillations in the previous week, 
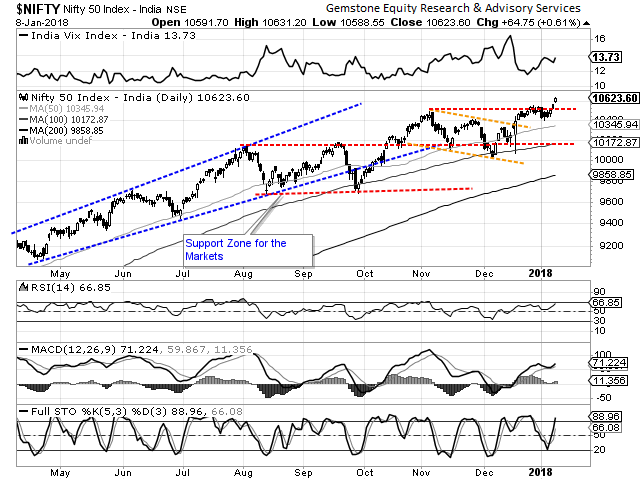
the benchmark NIFTY50 ended the week with a small up-tick as it ended with net gains of 122.40 points or 1.16%. Most of the entire previous week was spent by the Markets consolidating in a defined range after it achieved its breakout from the 10490 zones. In the coming week, we might see the Markets continuing to trade in a defined range with a upward bias. As indicated by F&O data, the NIFTY is likely to advance to test its 24-month rising trend line and following that, might see some corrective moves. The possibility of the NIFTY testing levels of 10750-10800 zones cannot be ruled out, though it may do so amid intermittent minor corrective moves.

The coming week will see the levels of 10750 and 10835 levels acting as possible resistance on the upside. Supports are likely to come in at 10600 and 10535 levels.

The Relative Strength Index – RSI on the Weekly Chart is 68.8730. A Bearish Divergence is observed as the NIFTY formed a fresh 14-period high while the RSI did not. Weekly MACD is bullish as it trades above its signal line. A Rising Window occurred on Candles. This is essentially gap and often results into continuation of up move.

The pattern analysis shows that the up move in NIFTY remains secularly in place. It is continuing to post higher highs amid intermittent consolidations and it may continue to doing so. However, around 10800-mark, it may face very stiff resistance to its 24-month long upward rising trend line.

Overall, if we take a immediate short term week for next 2-3 weeks while we approach the Union Budget by that time, we may see some run-up continuing. However, in great likelihood, the Markets will not disregard the serious resistance of 24-month long trend line that it will approach in the process. We recommend that while making select purchases with each consolidation or minor corrective move that we witness, the up moves should also be utilized in realizing profits at higher levels and lighten the portfolios as we approach the 10800-mark. Any moves following that should be made to re-balance the portfolios or re-allocate the trading positions.
A study of Relative Rotation Graphs – RRG that PSUBANKS are evidently slowing down on momentum on a weekly note. We will continue to see MEDIA, REALTY, AUTO along with NIFTY Next 50 attempting to relatively out-perform the Markets. Service Sector stocks along with FMCG are attempting to consolidate its performance and may continue to do so in coming week as well. PHARMA has been underperforming over past several weeks and may remain an under performer on a Weekly basis. METALS and MID CAP Universe along with IT may see stock specific out-performances against the general Markets.

Important Note: RRG™ charts show you the relative strength and momentum for a group of stocks. In the above Chart, they show relative performance as against NIFTY Index and should not be used directly as buy or sell signals.

(Milan Vaishnav, CMT, MSTA is Consultant Technical Analyst at Gemstone Equity Research & Advisory Services, Vadodara. He can be reached at milan.vaishnav@equityresearch.asia

Milan Vaishnav, CMT, MSTA
Technical Analyst
(Research Analyst, SEBI Reg. No. INH000003341)
Member
CMT Association (Formerly Market Technicians Association, (MTA), USA
Canadian Society of Technical Analysts, (CSTA), CANADA
Society of Technical Analysts, STA (UK)


+91-70164-32277  /  +91-98250-16331 


MARKET OUTLOOK FOR FRIDAY, JAN 12, 2018

MARKET OUTLOOK FOR FRIDAY, JAN 12, 2018
Very much on the expected line the Indian Equity Markets continued to positively consolidate for the third day. The benchmark NIFTY50 Index ended the day on a positive note gaining 19 points or 0.18%. While we go into the trade on Friday, we expect the session to trade on similar lines. The Markets will continue to consolidate with limited downside and are likely to stay in a defined range.

The levels of 10665 and 10710 are likely to play out as resistance area for the Markets. Supports are likely to come in at 10615 and 10570.

The Relative Strength Index – RSI on the Daily Charts is 68.0999 and it has marked a fresh 14 – period high which is bullish. It does not show any divergence against the price. The Daily MACD remains bullish as it continues to trade above its signal line. No significant formations are observed on Candles.

The pattern analysis shows the NIFTY creating a small congestion zone after the breakout is achieved above the 10490 mark. There are minor chances that it suffers a minor throwback but despite that it is likely to consolidate an inch higher.

Overall, the intent of the Markets continues to exhibit bullish bias. Though there are minor chances of a small corrective move, all the supply will be outnumbered by demands at lower levels. We expect the momentum to continue and while discounting the chances of minor corrective moves, the NIFTY is set to taste 10700 – 10725 levels in the near term. Cautious optimism is advised for the day. 

Milan Vaishnav, CMT, MSTA
Technical Analyst 
(Research Analyst, SEBI Reg. No. INH000003341)


Member: 
CMT Association (Formerly known as Market Technicians Association, (MTA), USA
Canadian Society of Technical Analysts, (CSTA), CANADA
Society of Technical Analysts (STA), UK  


+91- 70164-32277  /  +91-98250-16331  

Thursday, January 11, 2018

MARKET OUTLOOK FOR THURSDAY, JAN 11, 2018

MARKET OUTLOOK FOR THURSDAY, JAN 11, 2018
The Indian Markets continued to consolidate for the second day as the Wednesday’s session a range bound trade. The benchmark Index NIFTY50 opened flat, slipped lower but recovered in the second half of the session to end the day with nominal loss of just 4.80 points or 0.05%. The consolidation continued to reflect underlying strength as the session continued to pile some more Open Interest in the derivative segment. We may see this consolidation persisting for some time. Thursday’s session may see a quiet to modestly positive opening and we may see the session continuing to witness stock-specific out-performances with limited downsides.

Thursday is likely to witness 10655 and 10690 as immediate resistance area. Supports are expected to come in at 10590 and 10550 levels.

The Relative Strength Index on the Daily Chart is 67.0054 and it remains neutral showing no divergences against the price. The Daily MACD stays bullish as it continues to trade above its signal line. A black body occurred on Candles. However, this remains insignificant when read in the present situation.

The pattern analysis shows a NIFTY attempting and achieving a clean break out as it moved past the 10490-mark. It has been consolidating since last two sessions. It would be important to see if the NIFTY consolidates in a narrow range or suffers a minor throwback before it continues with its up move.

All and all, the current structure of the Charts read along with the F&O data continue to portray a favorable picture for the Markets before a run-up to the union budget. The NIFTY has achieved a breakout and is likely to continue with its up move in the immediate near term. However, the only thing that needs to be sees is that the NIFTY consolidates in a narrow range or suffers a minor corrective throw back before resuming its up move. While we are in this formation, we recommend continuing to make select purchases and maintaining a cautious positive outlook on the Markets.

Milan Vaishnav, CMT, MSTA
Technical Analyst 
(Research Analyst, SEBI Reg. No. INH000003341)


Member: 
CMT Association (Formerly known as Market Technicians Association, (MTA), USA
Canadian Society of Technical Analysts, (CSTA), CANADA
Society of Technical Analysts (STA), UK  


+91- 70164-32277  /  +91-98250-16331  

Wednesday, January 10, 2018

MARKET OUTLOOK FOR WEDNESDAY, JAN 10, 2018

MARKET OUTLOOK FOR WEDNESDAY, JAN 10, 2018
After two days of breaking out above 10490-mark, the Indian Equity Markets took a breather and consolidated on Tuesday. The benchmark NIFTY50 ended with a negligible gains of 13.40 points or 0.13%. However, it continued to pile up Open Interest. Though we expect a quiet opening on Wednesday, we expect that despite some consolidation, we will ultimately see the Index inching higher after some range bound movement, if any. The buoyant intent is further support by Inter-market analysis of the Hong Kong markets with which our Markets remain very strongly co-related. Hang Seng Index has went on scale further lifetime highs.

Wednesday will see the levels of 10655 and 10710 working out as resistance area for the Markets. Supports come in at 10590 and 10545 levels.

The Relative Strength Index – RSI on the Daily Charts 67.5491 and it has marked its fresh 14-period high which is bullish. The Daily MACD stays bullish while trading above its signal line. No major formations were observed on Candles.

The pattern analysis reveals the NIFTY taking some breather after two days of breaking out. This consolidation may last but overall under current continue to remain buoyant.

After two days of up move, it will be no surprise if the Markets see a range bound consolidation or movements in a defined range. However, at no point, it shows any sign of a major corrective move. In most likelihood, we may see the Markets consolidating for a while and then resuming its up move. We continue to recommend making selective profits with each consolidation that occurs. Overall, continuation of positive outlook is advised for the day.

Milan Vaishnav, CMT, MSTA

Technical Analyst 
(Research Analyst, SEBI Reg. No. INH000003341)


Member: 

CMT Association (Formerly known as Market Technicians Association, (MTA), USA
Canadian Society of Technical Analysts, (CSTA), CANADA
Society of Technical Analysts (STA), UK  


+91- 70164-32277  /  +91-98250-16331  

Tuesday, January 9, 2018

MARKET OUTLOOK FOR TUESDAY, JAN 09, 2018

MARKET OUTLOOK FOR TUESDAY, JAN 09, 2018
The benchmark NIFTY50 confirmed its breakout after attempting to move past the 10490-10535 zones as it continued to inch higher and ended the day with net gains of 64.75 points or 0.61%. Given the present set up on the Charts, despite some brief consolidation, the Markets are steadily headed towards the 10650-10690 levels over coming days. Tuesday is likely to see a positive opening and the Markets may extend its gains, at least in the early part of the trade.

The levels of 10650 and 10695 will act as immediate area of resistance for the Markets. Supports come in at 10590 and 10565 zones.

The Relative Strength Index – RSI on the Daily Chart is 66.8519 and it has marked a fresh 14-period high which is bullish. The Daily MACD stays bullish while trading above  its signal line. On Candles, yet another Rising Window occurred. There are 8 Rising Windows in last 50 Candles and this makes the current Rising Window even more bullish.

The pattern analysis confirms a breakout above the 10490-10535 resistance area. The momentum is likely to persist as the Markets have formed a continuation gap as it advanced higher with the breakout.

Overall, we expect the buoyant intent of the Markets to persist for some more time. Though some consolidation at around 10690 levels cannot be ruled out, the overall upward momentum is likely to remain steadily bullish. We expect the Markets to test these levels and beyond while it is expected to resist to 24-month long trend line on the Weekly Charts. We reiterate completely avoiding shorts and continue making select purchases while vigilantly watching profits at higher levels. Positive outlook is advised for the day.

Milan Vaishnav, CMT, MSTA
Technical Analyst 
(Research Analyst, SEBI Reg. No. INH000003341)


Member: 
CMT Association (Formerly known as Market Technicians Association, (MTA), USA
Canadian Society of Technical Analysts, (CSTA), CANADA
Society of Technical Analysts (STA), UK  


+91- 70164-32277  /  +91-98250-16331  

Monday, January 8, 2018

MARKET OUTLOOK FOR MONDAY, JAN 08, 2018

MARKET OUTLOOK FOR MONDAY, JAN 08, 2018
After consolidating in the first half of the session, the Friday’s session saw the benchmark NIFTY50 attempting to confirm its breakout. The Markets ended at the high point of the day with the Index ending the day with net gains of 54.05 points or 0.51%. Going into trade on Monday, we expect a quiet start to the Markets. Having said this, we also feel that despite some consolidation, the NIFTY is ultimately set to inch higher testing the levels of 10650-10690 in coming days. These levels may be tested if the attempted breakout gets confirmed.

The levels of 10590 and 10635 will play out as immediate resistance levels while the supports will come in at 10530 and 10490 levels.

The Relative Strength Index – RSI on the Daily Chart is 63.3155. It shows a minor bearish divergence as the NIFTY marked a fresh 14-period high while the RSI did not. However, it is seen breaking out from a pattern formation.  The Daily MACD stays bullish while trading above its signal line. On Candles, a Rising Window occurred. This is usually a gap and often results into continuation of up move.

The pattern analysis shows a clear attempt by NIFTY to break above the 10490 zone. It has attempted a breakout and in all likelihood,  it may confirm this in coming days even if we see this confirmation after some intermittent consolidation.

All and all, the buoyant intent of the Markets is evident and we may continue to see select pockets continuing to robustly out-perform the general markets. Despite some consolidation that we might see at higher levels once again, there are no signs of any evident weakness on the Charts. We reiterate to completely avoid shorts and use all consolidation or minor corrective move to pick select stocks while also continuing to protect profits at higher levels.

Milan Vaishnav, CMT, MSTA
Technical Analyst 
(Research Analyst, SEBI Reg. No. INH000003341)


Member: 
CMT Association (Formerly known as Market Technicians Association, (MTA), USA
Canadian Society of Technical Analysts, (CSTA), CANADA
Society of Technical Analysts (STA), UK  


+91- 70164-32277  /  +91-98250-16331