Friday, March 30, 2012

Daily Market Trend Guide -- Friday, March 30, 2012

MARKET TREND FOR TODAY                                                          March 30, 2012
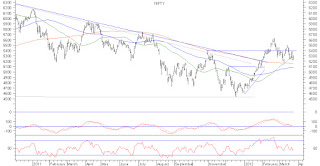
The Markets held on to its 200-DMA which is its major support at Close as it ended the day yesterday amid volatility with just nominal losses. The Markets opened on a negative note following weak global cues and remained negative for the entire session. The Markets, after briefly trading in a range, pared some of its recovery in the afternoon trade as it gave its intraday low of 5135.95. However, in the second half of the session, it saw a smart recovery and recovered almost most of its losses. It finally ended the day at 5178.85, posting a nominal loss of 15.90 points or 0.31%. In the process, it has formed a mild lower top and lower bottom on the Daily High Low charts.

Yesterday was the expiry of the March series and it remained expectedly volatile. The Markets did went below its important support levels of 200-DMA, which is 5149 today, but has closed well above its and has held that level as a support on the Close Charts, which is certainly a positive sign.

For today, we can expect some stability to return to the Markets and we may see some respite from the weakness that we saw yesterday as the Markets show some signs of this happening. For today, expect the Markets to open on a moderately positive note and look for directions. The intraday trajectory that it forms after opening would be very crucial to determine the trend for today. The Markets may consolidate with upward bias but will have to maintain and trade above its 200-DMA in order to avoid any weakness.

The RSI—Relative Strength Index on the Daily Chart is 42.7309 and it shows no failure swings. The NIFTY has given its 14-day low but the RSI has not and this is BULLISH DIVERGENCE. The Daily MACD continues to trade below its signal line.

The Markets saw short covering which was expected with the Markets trading near their important support of 200-DMA. It is important to note that there is not structural breach of any king on the Daily Charts as the Markets continue to trade above its 200-DMA. Both Stock and NIFTY Futures have shown minor addition in Open Interest too.

All and all, with no negative breach on the Charts as of now, the Markets are likely to trade and consolidate with upward bias. Shorts should be avoided with the Markets trading above its important support levels and this opportunity should be used to take longs on selective basis. The weakness shall creep in only if the Markets moves and closes below its 200-DMA and its filter and until this happens, it is likely to consolidate with upward bias. Overall positive approach is advised for today.

Milan Vaishnav,
Consulting Technical Analyst,
+91-98250-16331


Wednesday, March 28, 2012

Daily Market Trend Guide -- Wednesday, March 28, 2012

MARKET TREND FOR TODAY                                                              March 28, 2012
The Markets yesterday traded almost precisely as expected yesterday as it traded with positive bias but remained equally volatile but ended the day with gains. The Markets opened on a positive note but initially failed to sustain its opening gains as it pared all of its gains to trade flat. It continued to trade in a range in the first half of the session, but it saw a sudden a sharp pullback once Government issued clarification and willingness to exempt P-Notes from GAAR. The Markets recovered very sharply to give its intraday high of 5277.95. However, it came off from those levels too, but in the end, again inched up in the volatile manner to finally end the day at 5243.15, posting a gain of 58.90 points or 1.14%. In the process, it has formed almost a Parallel Bar on the Daily High Low Charts.

For today, the analysis for the Markets would remain more or less the same as that of yesterday. We may continue to see  volatility in the Markets with them trading with them with overall positive bias.
For today, expect the Market to open on a flat to moderately negative note and look for directions. As yesterday, the intraday trajectory that it forms shall continue to be important in deciding the trend for the day. The levels of 5290 and 5340 shall act as immediate resistance on Charts and the levels of 5180 and 5152 in the form of 200-DMA shall act as major support for the Markets.

The RSI—Relative Strength Index on the Daily Chart is 46.2496 and it continues to remain neutral as it shows no negative divergence or any failure swing. The Daily MACD continues to trade below its  signal line.

Having said this, it is also important to note that today is the penultimate day of expiry of current derivative series and the session is also likely to remain dominated with rollover centric activities. The F&O data continues to suggest short covering yesterday but still, large amount of shorts still exists in the system. The support is likely to come in from these shorts and also some fresh longs that are likely to be created.

All and all, volatility in the Markets is likely to continue. With no structural breach on the Charts, the Markets shall remain in a broad range swinging either way and volatile. Fresh sustainable up move is expected only above 5400-5420 range but until that occurs the Markets are likely to exhibit very volatile behaviour but are likely to trade with overall upward bias. Thus, like yesterday, short should be strictly avoided and it is advised to remain highly stock specific and selective. The day should be approached with positive caution.

Milan Vaishnav,
Consulting Technical Analyst,
+91-98250-16331


Tuesday, March 27, 2012

Daily Market Trend Guide -- Tuesday, March 27, 2012

 MARKET TREND FOR TODAY                                                          March 27, 2012
FII selling continued in the Markets reportedly due to new GAAR (General Anti-Avoidance Rules) coming into effect from April 1st , which will make the P-note  based transactions taxable as the Markets continued to slide despite no major trigger and continued to end yet another day with losses. The Markets opened mildly positive and gave its intraday high of 5274.95 in the  very early seconds of the trade. However, immediately post opening, it dipped into the day remained weak throughout the session in a negative falling trajectory and went on to give the day’s low of 5174.90. It went on to end the day at 5184.25, posting a cut of 93.95 points or 1.78%. It has formed a lower top and lower bottom on the Daily High Low Charts.

Yesterday’s sell-off was mainly led by the confusion on GAAR as mentioned above. However, some clarifications issued yesterday late evening and some today morning are likely to instil some stability in the Markets. This is also likely to be aided with the global positive cues.

Also, most important to note that there is still no structural breach of any kind on the Charts as evident from above and the Markets still rules above its major support of its 200-DMA. 

Taking all this into consideration, we can expect the Markets to open today much stronger and positive and are likely to trade strong, at least in the initial trade. It would be very critically important for the Markets to remain in the positive rising intraday trajectory to ensure it can capitalize on the stronger opening it is likely to get.

All lead indicators continue to remain in place. The RSI—Relative Strength Index on the Daily Chart is 42.2823 and it has reached its lowest value in last 14-days but it does not show any negative  divergence. The Daily MACD continues to remain below its signal line.

Further to this, both NIFTY Futures and Stock futures have added Net Open Interest and thus this clearly signifies creation of fresh shorts in the Markets. These shorts and the levels of 5154 which is the 200-DMA of the Markets are all likely to offer major supports to the Markets and overall, the Markets may remain in a broad range of 5180-5400 trading band in this week until expiry. Any serious and significant breach shall occur only if the Markets breaches its 200-DMA which is very much unlikely. However, the volatility may remain due to disturbance caused by GAAR issue and also due to the expiry week that we have. This may keep the Markets range bound and also volatile with it seeing swings on either side. But given the technicals and the F&O data, the bias remains toward stability returning in the Markets.

All and all, it is continued to advised to maintain high degree of caution and aggressive positions, especially shorts should be avoided. Longs should be selectively taken and as always, profits be protected vigilantly. Overall, positive outlook, but with some degree of caution is advised for today.

Milan Vaishnav,
Consulting Technical Analyst,
+91-98250-16331


Monday, March 26, 2012

Daily Market Trend Guide -- Monday, March 26, 2012

MARKET TREND FOR TODAY                                                            March 26, 2012
The Markets had an extremely volatile session on Friday as it remained in arrange for the half of the session and then perked up to end the day with decent gains. The Markets opened on a moderately positive note as expected but traded volatile in a capped range until later morning trade. However, in the second half of the session, the Markets saw support coming in at levels mentioned in our Friday’s edition of Daily Market Trend Guide as it saw a sharp pullback. The Markets went on to give the day’s high of 5312.Though it came off a bit in the last half hour of the trade and ended the day at 5278.20, posting a gain of 49.75 points or 0.95%. With this, it has ended the week with net loss of 39.75 points or 0.69%, while forming a higher top but lower bottom on the Daily High Low Charts. 

For today, the Markets are expected to open on a moderately negative note and look for directions. The Markets have ended the day on Friday near their support levels and thus the volumes and the intraday trajectory that it forms shall continue to play the critically important role for the day as well as for the coming week.

For today, the levels of 5280, which is the 50-DMA for the Markets should act as support at Close levels. Any breach below that will have the Markets find support at 5205 levels and then at  200-DMA.

All lead indicators continue to remain in place on both Daily and Weekly Charts. The RSI—Relative Strength Index on the Daily Chart is 47.4720 and is neutral as it shows no negative divergence or failure swings. The Daily MACD continues to trade below its  signal line. On the Weekly Charts too, the RSI is neutral as it shows no negative divergence or failure swings. The Weekly MACD is bullish as it trades above its signal line.

F&O data continue to show divergent trends which NIFTY futures shedding over 16 lakh shares in total Open Interest while stock futures adding over 18 lakh shares. This signifies that there has been some short covering in the NIFTY Futures and some fresh longs seems to have been added in the stock futures. NIFTY Short covering needs to be replaced with the longs in order to sustain Friday’s pullback.

All and all, the Markets are overall expected to trade in a broad range with the levels of 5205 and 5150 acting as lower band of the broad trading range. There is still no structural breach on the Charts and thus, it is strongly advised to refrain from shorts. Also, this being an expiry week, the Markets may continue to see volatility. Stock specific  action would be seen and thus longs should be taken on very selective basis with vigilant protection of profits at higher levels. Overall, positive but cautious approach is advised for today.

Milan Vaishnav,
Consulting Technical Analyst,
+91-98250-16331