WEEKLY MARKET OUTLOOK FOR NOV 06 THRU NOV 10, 2017
In our previous Weekly note, we had mentioned about
possibilities of the benchmark NIFTY50 marking fresh marginal highs while still
not giving any meaningful up move. In line with this analysis, in the Week that
has gone by, the Index continued to mark fresh highs but ended up with net
gains of just 129.45 points or 1.25%. In the coming week, we expect the
benchmark Index to there are enough signals on the Charts that indicate that
any meaningful and serious up move will still continue to elude us. In most
likelihood, with the liquidity chasing the momentum vigorously, we will see
NIFTY marking intermittent marginal highs.
At this juncture, despite very buoyant undercurrents, we
cannot ignore the fact that there are evident bearish divergences on the lead
indicators. On the top of this, as very clearly marked on the Charts, the NIFTY
has resisted to the upper trend line of the 22-month long upward rising channel
that it has been trading in. This is all likely to force and keep the Markets
under consolidation at higher levels.
The levels of 10525 and 10690 will play out as immediate
resistance levels. Supports exist at 10360 and 10220.
The Relative Strength Index – RSI on the Weekly Chart is 70.9877.
It trades moderately overbought. A bearish divergence appears as the NIFTY has
marked a fresh 14-period high while RSI did not. Weekly MACD has reported a
positive crossover and it is now positive trading above its signal line.
Pattern analysis clearly indicates the Index testing the
upper band of the 22-month long trading channel that it has been trading in. In
all likelihood, we see the Markets consolidating at higher levels.
All and all, it is beyond all discussions that the
undercurrent setup remains buoyant. The only reason Markets have to take a
breather is that it has tested the 22-month long trend line and might resist
there. Another reason is the persistent bearish divergences that appear on the
lead indicators. The F&O data indicates that downsides, if any would remain
limited. However, there are all indications that the coming week may remain
volatile in nature and see highly sector specific performances taking place.
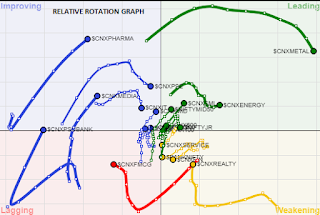
A study of Relative Rotation Graphs – RRG show that significant
improvement is seen in PSUBANK pack mainly due to its move in the previous
week. It is seen that the PHARMA, AUTO, MEDIA and MIDCAP packs are clearly
readying themselves to take on the baton as next relative out-performers over
coming week. REALTY is still seen consolidating while the FMCG pack is likely
to continue to lag and relatively underperform the general markets. INFRA too
is showing distinct signs of strength. METAL is seen slowly continuing to give
up momentum though may consolidate and show limited downsides.
Important Note: RRG™ charts show you the relative strength and momentum for a group of
stocks. In the above Chart, they show relative performance as against NIFTY
Index and should not be used directly as buy or sell signals.
(Milan Vaishnav, CMT, MSTA is
Consultant Technical Analyst at Gemstone Equity Research & Advisory
Services, Vadodara. He can be reached at milan.vaishnav@equityresearch.asia
Milan Vaishnav, CMT, MSTA
Technical Analyst
(Research Analyst, SEBI Reg.
No. INH000003341)
Member:
CMT Association (Formerly Market Technicians Association, (MTA), USA
Canadian Society of Technical Analysts, (CSTA), CANADA
Society of Technical Analysts, STA (UK)
+91-70164-32277 / +91-98250-16331


No comments:
Post a Comment
Note: Only a member of this blog may post a comment.