WEEKLY MARKET OUTLOOK FOR MAY 01 THRU MAY 05, 2017
The Indian Equities had much
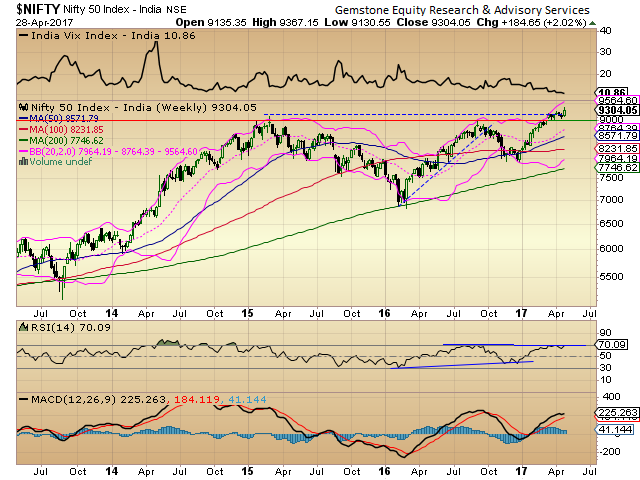
better-than- expected week as despite consolidation in the initial days, the
benchmark NIFTY50 ended the week on a buoyant note putting on net gains of
184.65 points or 2.02% on Weekly basis. On expected lines, select out-performance was seen from MIDCAPS and BANKS, and some consolidation of
performance was seen from AUTO. In the coming week, the picture is clear. There
are all signs of consolidation on the Daily Charts and virtually no signs of
any reversal of the primary uptrend on Daily or Weekly Charts. This translates
into buoyant outlook in the coming week. We can expected a fierce consolidation
with some volatility given the overbought nature of the Markets but no significant
downsides are expected.
The levels of 9360 and 9450
will act as resistance for the coming week while supports will come in at 9220
and 9150 zones.
The Weekly RSI is 70.0947 and
it is bullish as it has marked a fresh 14-period high though it is mildly
overbought. The Weekly MACD continue to remain bullish as it trades above its
signal line.
The pattern analysis on the
Weekly Charts presents a buoyant picture. It shows the NIFTY resuming its up
move again after a brief sideways consolidation after the main breakout from
the triple top formation. However, given the overbought nature of the Markets
on Weekly Charts and multiple pattern resistance on the Daily Charts, we may
see the Markets spending some time in the broad range.
All and all, it is extremely
important to note that though we may continue to see some intermittent profit
taking bouts given the multiple pattern resistances that the Markets may
encounter, there are no signs of reversal of the primary uptrend. We may also
see some volatility creeping in over next week. However, all corrective actions
should be contiued to utilized to make fresh purchases. The 45%
wider-than-normal bands may not allow runaway rise for the NIFTY but the
inherent structure of the Markets remain bouyant.

A study of Relative Rotation Graphs – RRG show that PSUBANKS
and BANKNIFTY are significantly expected to further improve the relative out-performance with NIFTY. The AUTO Stocks and ENERGY universe is also expected
to outperform. PHARMA is likely to continue to lag and METALS and IT Stocks are
expected to remain weaker. Financial Services and MIDCAP universe will see
pockets of select out-performance. INFRA and FMCG are expected to consolidate.
Important Note: RRG™ charts show you the relative strength and
momentum for a group of stocks. In the above Chart, they show relative
performance as against NIFTY Index and should not be used directly as buy or
sell signals.
(Milan Vaishnav, CMT, is
Consultant Technical Analyst at Gemstone Equity Research & Advisory
Services, Vadodara. He can be reached at milan.vaishnav@equityresearch.asia)
Milan Vaishnav, CMT
Technical Analyst
(Research Analyst, SEBI Reg.
No. INH000003341)
Member:
Market Technicians Association, (MTA), USA
Canadian Society of Technical Analysts, (CSTA), CANADA
+91-98250-16331
No comments:
Post a Comment
Note: Only a member of this blog may post a comment.