MARKET TREND FOR TODAY December 20, 2011
The Markets had an extremely volatile session yesterday as it remained in a 35-odd point range for the most part of the session, but swinged wildly in the either direction. However, the Markets did not lose beyond the opening losses as it resisted to weakness and saw some short covering towards the end to end the day at 4613.10, posting a loss of 35.50 Points or 0.83%. With this, the Markets have lost 449.50 points or 9.21% in last eight sessions. In this process, the Markets have formed a lower top and lower bottom on the Daily High Low charts.
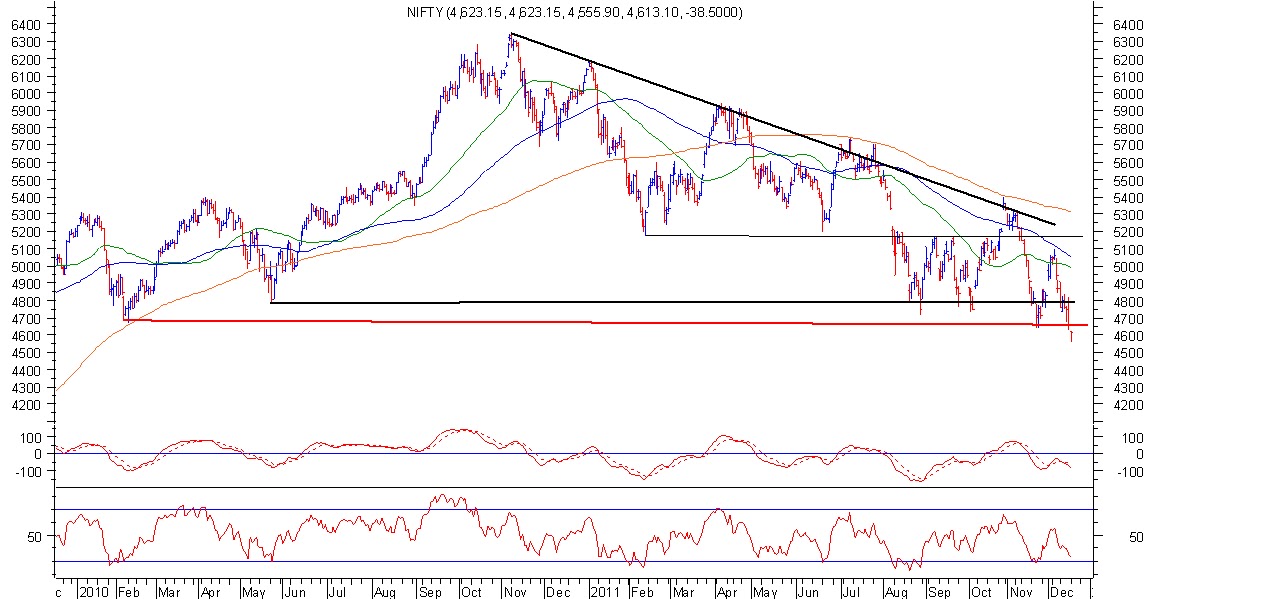
As evident from the above chart, the NIFTY has broken down the support of 4692 and have formed a distinct lower top and lower bottom on the Daily High Low Charts. However, the overall analysis of the expected trend today would remain more or less with the analysis carried out for yesterday. That means, even if some weakness persists due to this weak pattern, it would be resisted by other technical factors.
Expect the Markets to open on a flat note and look for directions and the intraday trajectory that it forms would be critically important to decide the trend for today. The levels of 4692 and 4735 shall act as resistance and yesterday’s intraday low of 4555 shall act as immediate support followed by levels of 4530.The contradictory reading of the NIFTY Futures shedding Open Interest and the Stock futures adding big open interest continues with other technical indicators pointing towards resistance to the downside.
The RSI—Relative Strength Index is 33.2573 and it has reached its lowest value in last 14-days which is bearish. The Daily MACD continues to trade below its signal line. However, on the Candles, A hammer occurred (a hammer has a long lower shadow and closes near the high). Hammers must appear after a significant decline or when prices are oversold (which appears to be the case with NIFTY) to be valid. When this occurs, it usually indicates the formation of a support level and is thus considered a bullish pattern.
Further, A hanging man occurred (a hanging man has a very long lower shadow and a small real body). This pattern can be bullish or bearish, depending on the trend. If it occurs during an uptrend it is called a hanging man line and signifies a reversal top. If it occurs during a downtrend (which appears to be the case with NIFTY) it is called a bullish hammer.
Also long lower shadow occurred on Candles. This is typically a bullish signal (particularly when it occurs near a low price level, at a support level, or when the security is oversold).
With the RSI very near to its OVERSOLD zone and the candles showing a potential bottom formation for the short term, any weakness is likely to be resisted. The NIFTY PCR is 0.91.
Overall, yesterday’s outlook for the Markets is reiterated and it is advised to continue to maintain liquidity while avoiding aggressive positions on either side, especially on the short side. With the Markets losing almost 10% straight, there are chances of a pullback, or at least resistance on the downside even while remaining in the overall falling channel. Caution with mild optimism is advised for today.
Milan Vaishnav,
Consulting Technical Analyst,
+91-98250-16331
No comments:
Post a Comment
Note: Only a member of this blog may post a comment.