WEEKLY MARKET OUTLOOK FOR OCT 30 THRU NOV 03, 2017
Despite and attempted breakout in the week that has gone by,
the Friday’s session remained much subdued as the Markets consolidated on
expected lines. We had expected the benchmark NIFTY50 to post modest up moves
and in line with this analysis, the NIFTY ended this week with net gains of
112.20 points or 1.10% on Weekly basis. The Markets did attempt to give a
breakout from the broad trading range but still saw no convincing gains after
that. In the coming week, we expect that the Markets still has potential to
keep giving marginal highs but any serious up move may still continue to elude
us. Coming week is likely to continue to remain more stock specific in nature.
The levels of 10360 and 10490 will play out as immediate
resistance area in the coming days. Supports come in at 10200 and 10060 zones.
The Relative Strength Index – RSI on the Daily Chart is 68.5187. There is an evident Bearish
Divergence on this indicator that shows that the NIFTY has marked a fresh
14-period high while RSI did not. The Daily MACD stays bearish while trading
below its signal line. No significant formations are observed on Candles.
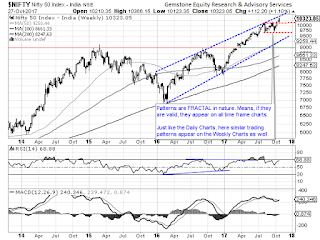
The pattern analysis shows that the Index has attempted a
breakout but is evidently lacking the conviction. More so, going ahead, it may
also resist the 18-month old rising trend line as seen on the Charts. All these
may force the Markets into consolidation at higher levels.
All in all, we cannot ignore the buoyant undercurrents that
are flowing in the Markets.
However, also we cannot ignore are the divergent
signals on the lead indicators, the fatigue that is evident and the other
technical factors which say that the NIFTY may continue to give marginal highs
in coming days but it is bound to face consolidation at higher levels as well.
Overall, the coming week is likely to remain stock specific and we may continue
to witness capped upsides and ranged consolidation over coming week.
A study of Relative Rotation Graphs – RRG show that while
METAL stocks have continued to relatively out-perform, the momentum is seen
fizzling out. Coming week will see sharp relative out-performance from MEDIA,
INFRA and PHARMA Stocks. ENERGY stocks too are seen losing momentum. No
significant out-performance is now expected from PSU and Private Banks. While
FMCG, SERVICE and REALTY stocks will
consolidate, the broader MIDCAP universe will see select outperformance. Some
momentum may now also be seen in AUTO Stocks.
Important Note: RRG™ charts show you the relative strength and momentum for a group of
stocks. In the above Chart, they show relative performance as against NIFTY
Index and should not be used directly as buy or sell signals.
(Milan Vaishnav, CMT, MSTA is
Consultant Technical Analyst at Gemstone Equity Research & Advisory
Services, Vadodara. He can be reached at milan.vaishnav@equityresearch.asia
Milan Vaishnav, CMT, MSTA
Technical Analyst
(Research Analyst, SEBI Reg.
No. INH000003341)
Member:
CMT Association (Formerly Market Technicians Association, (MTA), USA
Canadian Society of Technical Analysts, (CSTA), CANADA
Society of Technical Analysts, STA (UK)
+91-70164-32277 / +91-98250-16331


