Tuesday, July 24, 2012

Daily Market Trend Guide -- Tuesday, July 24, 2012

MARKET TREND FOR TODAY                                                        July 24, 2012
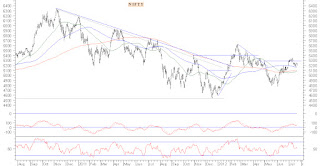
Markets had a thoroughly disappointing session as it succumbed to global weakness and drifted lower after a negative opening to end the day with further losses. The Markets opened on a weaker and negative note and opened around its short term support levels. As the session went ahead, it showed no signs of recovery and went on to give the day’s low of 5108.10. No attempts to recover were seen as the Markets ended the day near the low point of the day at 5117.95 posting a loss of 87.15 points or 1.67%. Though the Markets breached the short term support levels, it still remained within the filters and  closed above its serious long term support levels. The volumes remained higher than the average and it has formed a sharply lower top and lower bottom on the Daily High Low Charts.

For today, expect the Markets to open on a flat to mildly positive note and look for directions. We can expected some stability to return as the Markets currently are very near to its important support levels. The intraday trajectory would continue to remain important and it shall dominate the trend for the day.

The levels of 5101, which is the 200-DMA for the Markets and the levels of 5089 which is the 50-DMA are likely to act as major supports for the Markets as Close levels. This is especially when, there is still no structural breach on the Daily Charts.

The RSI—Relative Strength Index on the Daily Charts is 42.2230 and it has reached its lowest point in last 14-days. Though it does not show any negative / bearish divergence. The Daily MACD continues to trade below its signal line.

Given this fact, it is important to note that there is net addition of Open Interest in Nifty Futures and Stock Futures across the board which signifies heavy creation of shorts in the system. Further to this, the NIFTY PCR stands at 0.99, which is quite healthy at this point.
Another important factor to note that the Markets are very near and trades a notch above its critical support levels of 200-DMA and 50-DMA. Further important to note from the pattern analysis is that the 50-DMA and 200-DMA are all set to give a positive crossover in coming days.

All and all, this being expiry week, we may see the movement dominated with rollover activities. The external factors might keep the markets tizzy and range bound and bit volatile, but only for a while. Since there is no structural breach as of today on our Charts, any positions, on either side should be taken quite selectively. Aggressive shorts should be avoided. Overall, continuation of cautious outlook is advised with mild optimism for today.

Milan Vaishnav,
Consulting Technical Analyst,
+91-98250-16331

Monday, July 23, 2012

Daily Market Trend Guide -- Monday, July 23, 2012

MARKET TREND FOR TODAY                                                               July 23, 2012
The Friday saw a very listless and lackluster session as the Markets opened negative and spent the entire session in a extremely narrow range and ended the day with moderate losses. The Markets opened on a negative note and gave its intraday low of 5197.50 in the early morning trade. It then spent the entire session in a very narrow 20-odd point range and ended the session around the same levels at 5205.10, posting a moderate loss of 37.60 points or 0.72%. It has formed a lower top and lower bottom on the Daily High Low Charts. On a Weekly note, the Markets have ended the week with moderate loss  of 22.15 points or 0.42%. The volumes remained below the average.

For today, though there is no negative signal / breach on the Daily or Weekly Charts, the domestic Markets are likely to open on a lower and negative note following global weakness and look for directions. Here, the technical would come into play as the opening levels would be around the support levels on the  Charts and it would be crucial to see if the Markets takes support around these levels during the day.

For today, the levels of 5165 and 5150 would be crucial support levels and the behavior of the Markets vis-à-vis these levels would be important to watch for.

Importantly, apart from there being no negative breach on the Daily and Weekly Charts, the lead indicators too continue to remain very much in place. The RSI—Relative Strength Index on the Daily Chart is 50.8012 and it shows no negative divergence or failure swings. The Daily MACD trades below its signal line. Even on the Weekly Charts, the RSI is 52.1612 and it is neutral as it shows no negative divergence or failure swings. The Weekly MACD is bullish as it trades above its signal line.

Further important to note that there has been no significant fall in the Open Interest is recorded in this entire week and thus, there are no indications of any high unwinding has been seen in the Markets.

However, we enter the expiry week today, and the sessions in the coming weeks are likely to remain dominated with rollover centric activities. That being said, the Markets shall also remain range bound and volatile given the technicals, but it is important to note again that there is no negative breach /  signals as of today on Daily or Weekly Charts.
All and all, opening around support levels expected. It would be critical to see if the Markets recovers as we go ahead in the session. Intraday trajectory would be very important to decide the trend for today. Aggressive positions on either side to be avoided and adequate liquidity should be maintained. Overall, cautious outlook is advised for today.

Milan Vaishnav,
Consulting Technical Analyst,
+91-98250-16331